To edit a widget, hover at the top-right corner and click the Widget Options icon.
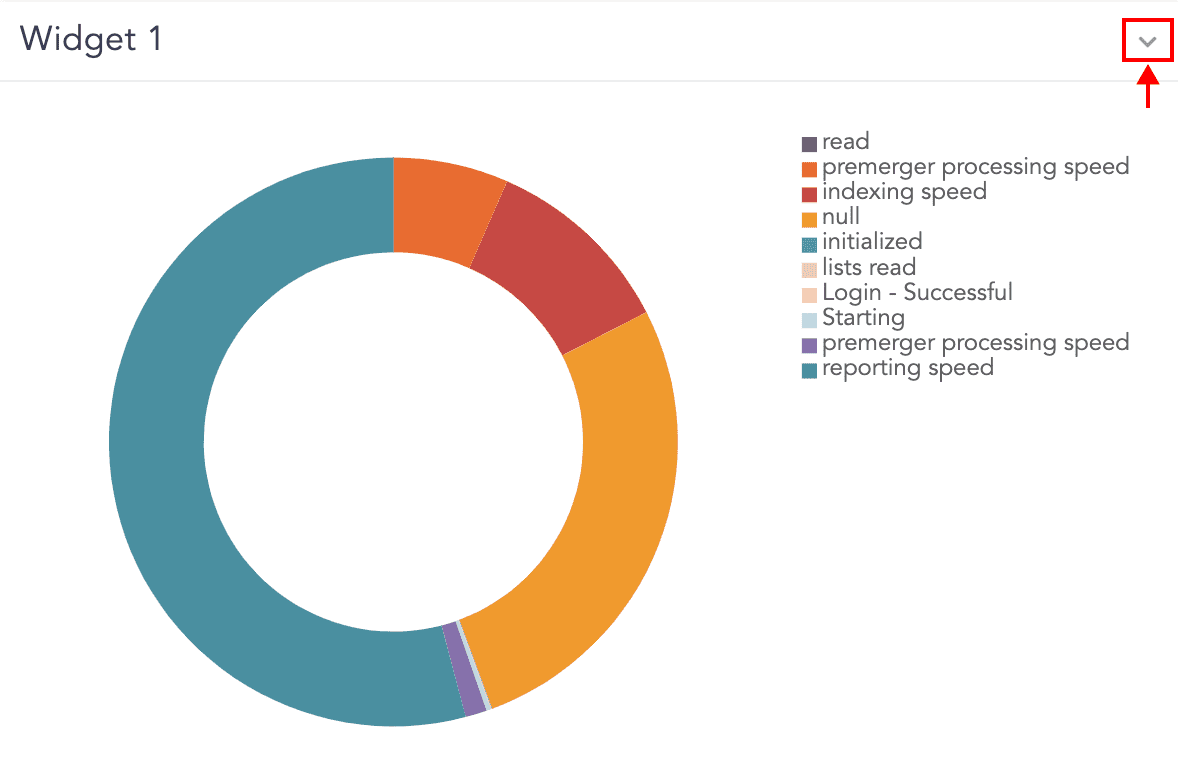
Widget Options Icon
You can view the following editing options for the widget. Use these options to make the changes.
Widget Options
You can Search for the results, get Info, Edit, Remove, and open the widget in Public URL. You can also toggle the display of the Legend if the currently selected visualization has legends.
Additionally, you can create Alerts and Incidents using the widget. Refer to the Alerts and Incidents section of the Search and Analytics guide for details.
Widget component lets you create graphs. You can monitor various activities through Table, Area chart, Line chart, Bar chart, Column chart, Gauge chart, Display chart, and Donut chart. However, the display types that are available for the results depend on the search you are making.
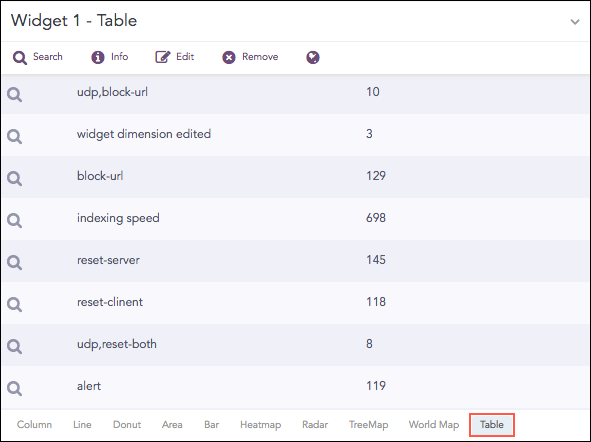
Count of logs grouped by device_ip
The following query gives the output shown above.
| chart count() by action
Other visualization types that are available in LogPoint are:
Detailed explanation about each visualization type can be found in the respective chart article under the Visualization category.